Free webinar

Register for our free webinar to learn how to improve efficiency and reduce operating costs in your plant.
Get ready to discover how to cut energy costs and boost OEE in your injection molding plant.
Keep an eye on your inbox — we'll be sending you a calendar invite with the webinar link.
Whether you’re exploring or ready to take action, begin at a pace that fits your operations — with zero pressure.
See how similar operations have improved
performance …
If you prefer to explore at your own pace, start here.
• Read real case studies from machining units
• Understand challenges, approach, and results
• See what changes delivered measurable impact
Get a quick sense of where you stand
today …
If you’re unsure about the extent of loss or opportunity, start here.
• Estimate potential energy and efficiency gaps
• Identify where improvements may exist
• Get a directional view before engaging further
See what’s possible — through real
examples …
Before evaluating your own setup, understand how similar units solve these challenges.
• Learn from real use cases and practical scenarios
• See how data improves performance and decisions
• Understand what actually drives measurable results
Understand how data is captured, visualized, and used in your operations …
Experience the solution before making a decision.
• Watch a live system walkthrough with real use cases
• Understand dashboards, insights, and reporting
• See how it applies to your machines and setup
Get clarity specific to your machines and
operations …
Move beyond generic insights and understand what this means for your setup.
• Discuss your current processes and challenges
• See how the solution fits your environment
• Get a clear view of potential savings and improvements
Understand what’s actually happening on your
shop floor …
Before trying anything new, get a clear picture of current performance.
• Assess machines, energy usage, and utilization
• Identify visible and hidden loss areas
• Validate improvement opportunities with real observations
Start without risk …
You don’t have to decide based on assumptions — experience it in your own setup first.
• Run the solution on your machines for 30 days
• Evaluate actual performance using real data
• Start small — with no long-term commitment
Structured to reduce your risk:
• Implementation cost adjusted in final rollout
• No disruption to ongoing production
• Designed for quick setup and clear evaluation
Validate results in your own plant …
Before expanding, ensure results are real, measurable, and relevant.
• Deploy on a limited set of machines
• Measure performance improvements with real data
• Compare before vs after outcomes clearly
Built to give you confidence:
• Pilot cost adjusted in rollout
• If results aren’t clear, we extend or refine
• Pay after improvement (for select cases)
Expand only when you’re ready …
Once results are proven, scale in a way that fits your operations.
• Roll out across machines in phases
• Pay as you scale — no heavy upfront commitment
• Standardize performance across operations
Designed for controlled growth:
• Phased deployment to minimize risk
• Flexible expansion aligned to your priorities
• Built for long-term operational consistency
Production teams rely on manual shift reports, energy teams rely on monthly utility bills, and machine data remains locked inside PLCs. The result is poor visibility into cost, downtime, and performance at the machine level.

Plant managers cannot see utilization, downtime, or idle losses across the molding shop floor as they happen.
Energy is measured at the plant level, but rarely mapped to a machine, mold, line, or finished component.
Quality issues are often reviewed after the shift, without linking machine events, process deviations, and rejects.
Operators and supervisors still depend on spreadsheets, handwritten logs, or delayed shift summaries.

Machines, energy meters, PLCs, and ERP applications operate independently without a common operational layer.

Downtime, energy spikes, and process losses are discovered only after they have already affected output and margin.
Bring machine data, energy usage, and execution data together in one connected platform built for injection molding operations.
Instead of separate dashboards for production and utilities, you get a single operational view for every shift and every machine.
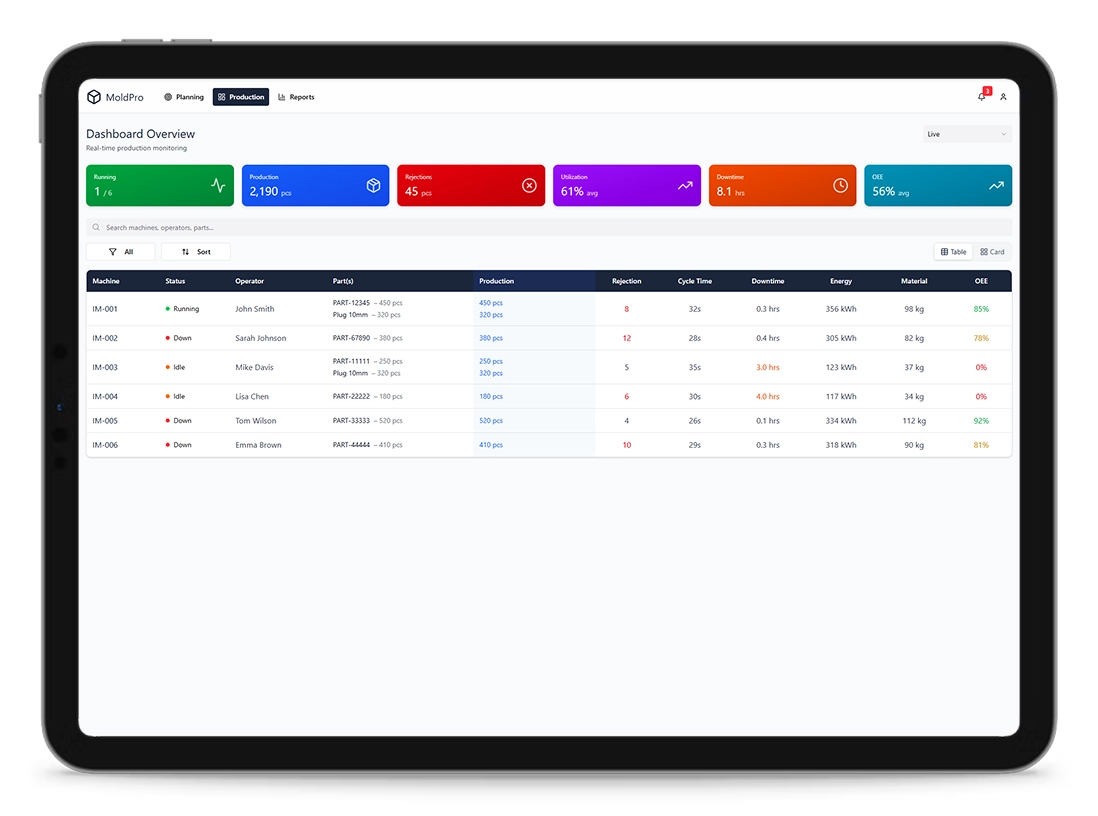
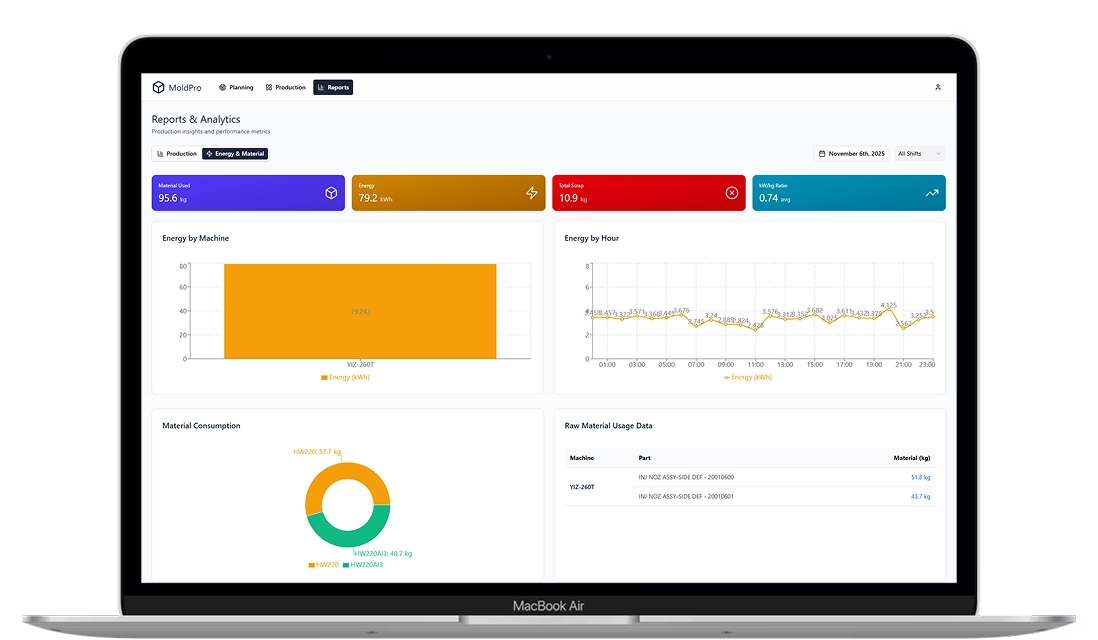
You are not investing in dashboards. You are investing in lower conversion cost, better output, and tighter process control.
Combining OEE, production analytics, and energy visibility helps plant managers improve output and reduce cost at the same time.
| Metric | Typical Improvement |
|---|---|
| Machine utilization | 10–20% |
| Scrap reduction | 5–10% |
| Energy efficiency improvement | 8–15% |
| Downtime reduction | 10–25% |
| Typical ROI payback | 6–12 months |
Injection molding plants often track production performance and energy consumption separately, making it difficult to understand the true cost of producing each part.
By combining machine performance, downtime, scrap, and energy usage in one system, plant teams can clearly see the actual cost per molded part and identify where losses occur during production.
This visibility helps teams reduce waste, improve machine capacity utilization, and control energy costs across every shift.





These capabilities are designed for factories that need production efficiency and energy accountability in the same operational system.

Connect injection molding machines and PLC controllers to capture machine status, cycle time, alarms, and production count.
Track availability, performance, and quality metrics across machines, molds, shifts, and lines to improve operational efficiency.

Measure machine-level and line-level power usage to identify energy-intensive assets and inefficient production time windows.

Analyze cycle behavior, downtime events, and bottlenecks to improve overall plant-wide throughput and resource utilization efficiency.

Track batches, work orders, and production history for better process transparency and quality follow-up visibility.
Integrate with systems such as SAP, Oracle Netsuite, Microsoft Dynamics , and other similar solutions to align orders, reporting, and execution data.
Access the production, energy, and operational insights relevant to your role so you can take faster action and improve plant performance.
A typical injection molding plant operates multiple machines across continuous production shifts. Even small improvements in machine utilization and energy efficiency can significantly impact operating cost.
If a molding plant operates 20 injection molding machines with an average connected load of 30-35 kW for 18-20 hours per day, energy consumption alone can exceed 3.5-4 million kWh per year.
By improving machine utilization, reducing idle energy usage, and stabilizing production cycles, plants typically achieve 8-10% operational efficiency improvements.
Reduced scrap and rework
Lower downtime losses
Higher machine utilization
Improved cost per good part
Gain real-time visibility into machine performance, downtime, scrap, and energy usage across your injection molding operation. Reduce operational cost and help plant teams make better decisions every shift.

We utilize Cookies to enhance your experience. Your acceptance implies our policy agreement. Your data is securely handled, and you can learn more about our commitment to data safety in our comprehensive Privacy Policy.