Create Multiple Dashboards
- An exceptionally customizable live MQTT Dashboard to get perfect visuals for your data from MQTT topics.
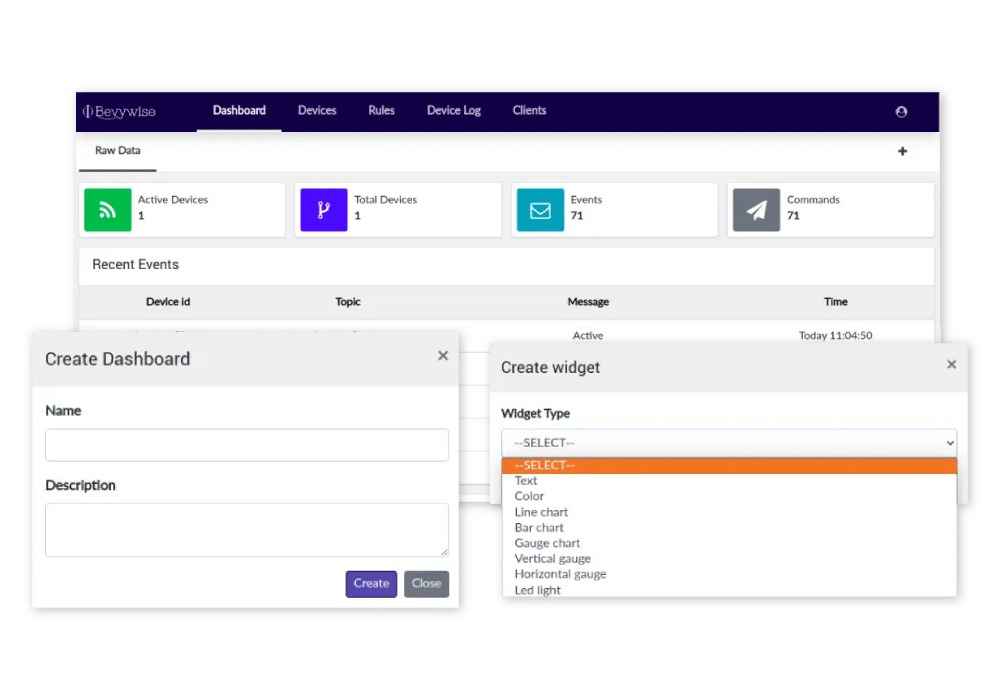
- Create your own multiple dashboards in minutes for data visualization & remote-device control in real-time.
- No design or coding skills are required. Just lay out the widgets on the dashboard, set up MQTT topics, and relish a stunning and value-bringing picture on the user interface.
- Assign the dashboards to multiple customers of your IoT applications.

Widgets for diversified use-cases
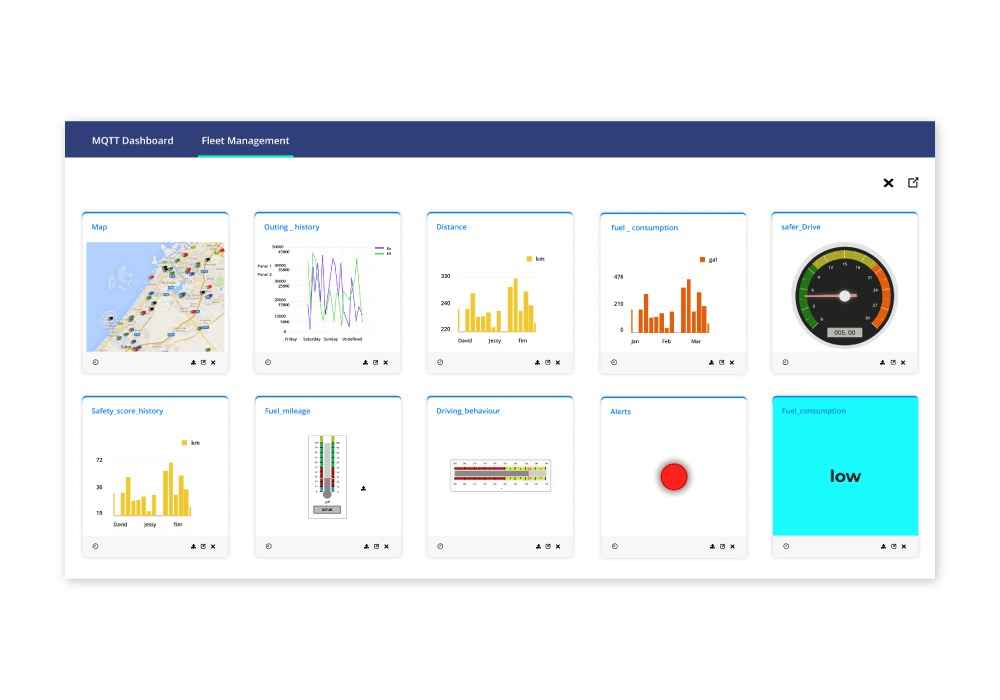
- 10+ live pre-built widgets to create end-user custom dashboards for varied use cases
- Display anomalies or performance metrics in real-time which helps you make data-driven business decisions by acting on time.
- Scalable to fit all industrial and commercial IoT deployments & implementations.
- Analyze data from the past to discern specific trends and comparisons of your application performance.
- A graphical display of data to compare two different sets of data from two similar devices.

Reports & History Graphs
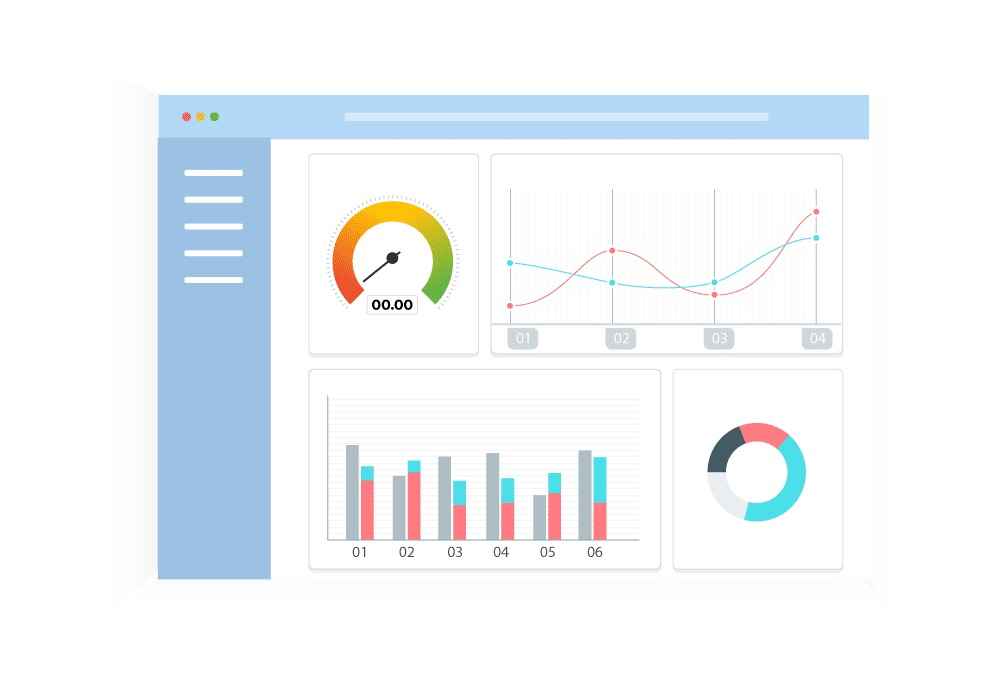
- Built-in visualization to visualize individual device data and topic payloads in real-time in the form of graphs & charts.
- Device to Device comparison graphs to compare two different devices with their data and topic payloads at different intervals.
- 5+ comparison models to generate comparison reports.
- The time comparison graph provides comparison reports for the payload which are published on two different days or months or years.
- Download the reports at any time in the form of a PDF.

Drive decision-making
- Access, interact, and analyze information by creating your own MQTT dashboard to make smart data-driven decisions.
- Make quick, efficient, and effective decisions by easily understanding the data and transforming it into actionable insight.
- Get instant insights into your most important data and metrics.
- Charts with scales of diverging colors will help users identify the problems without knowing the data.
- The Widgets with different color variations will alert the users and help them easily capture anomalies and make necessary decisions.
Lets Get Started
Highly Customizable MQTT Dashboard
Empower Your IoT Experience with Seamless Control and Insights
